Portable System Informer 3.2.25011

System Informer Portable is a free, open‑source, multi‑purpose system utility for Windows that combines advanced process management, real‑time performance monitoring, debugging tools, and malware hunting capabilities into a single, portable application. Originating as the successor to Process Hacker, it is designed for power users, developers, system administrators, and security professionals who need deep visibility into what is running on a machine, how resources are being used, and which components may be misbehaving or malicious. Distributed under the MIT license and available in 32‑bit, 64‑bit, and ARM64 builds, it can run as a portable executable without installation, yet exposes low‑level information far beyond the standard Windows Task Manager.
Core Purpose and Design Philosophy
System Informer Portable is built around the idea of giving users complete, real‑time insight into system activity—processes, threads, services, drivers, handles, modules, memory, disk I/O, GPU, and network connections—through a highly customizable interface. It targets three main use cases: performance troubleshooting (finding resource hogs), software debugging (inspecting stacks, modules, and handles), and malware detection (spotting suspicious processes and connections).
Unlike basic task monitors, it exposes kernel‑level details such as stack traces with kernel‑mode, WOW64, and .NET support, and can interact directly with services, drivers, and open handles. The application is optimized for responsiveness even on busy systems, with live graphs and sortable lists updating in real time, and can be themed to match user preferences.
User Interface and Navigation
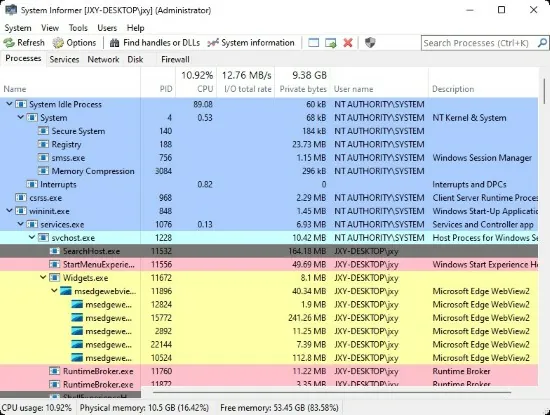
The main window presents a tabbed interface with sections such as Processes, Services, Network, Disk, and Performance, each providing a focused view into a different aspect of the system. The Processes tab resembles an advanced Task Manager: a tree view of running processes, with color‑coded highlighting for items like new processes, services, suspended tasks, and terminated processes.
Columns are fully configurable: users can add or remove dozens of fields—CPU usage, private bytes, working set, I/O reads/writes, handles, GDI/User objects, integrity level, session ID, command line, parent process, and more—then sort or group by any column. A powerful search feature filters processes by name, PID, path, or description, and process highlighting draws attention to spikes in CPU, memory, or I/O.
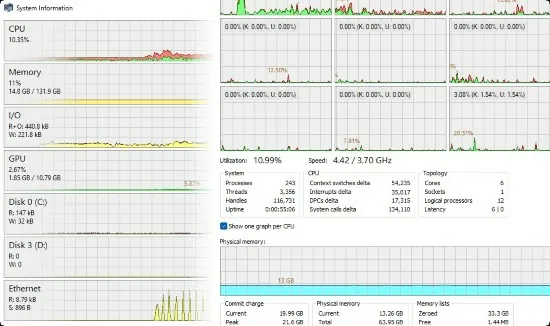
Performance graphs show CPU, memory, disk, GPU, and network activity over time, with tooltips revealing precise values at each point. A keyboard shortcut (for example, Ctrl+I in the default configuration) opens a detailed performance view, and double‑clicking a graph segment can jump directly to the process responsible at that moment—even if it has already exited.
Process Management and Inspection
Process management is at the heart of System Informer Portable. From the Processes tab, users can:
-
Terminate, suspend, resume, or restart processes with different levels of force, including terminating entire process trees.
-
Change process priority and CPU affinity, pinning processes to specific cores for performance diagnostics or sandboxing.
-
Elevate or reduce privileges where possible, and inspect security descriptors and integrity levels.
Opening a process’s properties reveals multiple sub‑tabs:
-
General: executable path, command line, user account, parent, start time, and environment variables.
-
Performance: live CPU, memory, and I/O metrics, historically trended.
-
Threads: each thread’s ID, CPU usage, start address, state, and call stack, with support for kernel‑mode and WOW64 stacks.
-
Modules: loaded DLLs, their paths, version info, and base addresses.
-
Handles: open file, registry, synchronization, and other kernel objects, with the ability to close handles directly.
These features make the tool invaluable for debugging hung applications (by inspecting stacks), diagnosing handle leaks, and understanding exactly what an executable is doing in memory.
File and Handle Utilities
One of System Informer Portable’s most practical capabilities is answering the classic “who is locking this file?” question. Its handle viewer can search across all processes for a given file path or filename, revealing which process has an open handle preventing deletion or modification. Users can then close the offending handle, or terminate/suspend the associated process, immediately freeing the file.
This functionality extends to other handle types, such as registry keys or named mutexes, which helps developers and administrators troubleshoot resource contention, registry permission issues, and inter‑process synchronization problems.
Network Monitoring and Connection Control
System Informer Portable includes a built‑in network monitor that lists active TCP and UDP connections, mapped directly to their owning processes. For each connection, it displays local/remote IP addresses and ports, connection state, and data throughput statistics, enabling quick identification of unexpected or suspicious network activity.
Users can sort connections by remote address, bandwidth, or process, and can close individual connections or terminate the owning process to immediately cut off communication. This is especially useful when diagnosing unknown background traffic, suspected malware beacons, or misconfigured services, and provides a more integrated view than separate command‑line tools.
Disk Activity and I/O Monitoring
Real‑time disk access monitoring reveals which processes are reading from or writing to specific volumes and files. The Disk tab shows per‑process I/O rates and cumulative counts, while a dedicated disk activity view can list individual file operations, helping users track down heavy disk usage, random I/O storms, or applications constantly touching log files.
This visibility is invaluable when chasing down sluggish systems caused by antivirus scans, background updaters, or misbehaving applications continuously hammering the disk.
GPU and System Performance Insights
System Informer Portable also exposes GPU usage metrics, showing per‑process GPU load and VRAM consumption where supported by the platform. Combined with CPU and memory metrics, this provides a comprehensive performance overview, particularly useful for gaming, GPU‑accelerated workloads, or diagnosing UI/rendering issues.
The Performance section aggregates system‑wide graphs, enabling users to correlate CPU spikes with disk activity or network bursts, and then drill down to the process responsible. This integrated telemetry essentially brings together functionality scattered across multiple native Windows tools into one coherent UI.
Service and Driver Management
System Informer Portable goes beyond the standard Services console by offering advanced service management capabilities. Users can list all services, filter by type or status, and start, stop, pause, continue, or delete services directly. It can also create and edit service configurations, adjusting startup types and dependencies, which is particularly helpful for tuning server workloads or investigating malware‑installed services.
Similarly, the tool can list loaded drivers and kernel‑mode components, providing insight into low‑level software that may not be visible through ordinary user‑mode tools.
Malware Detection and Security Use Cases
Although System Informer Portable is not an antivirus product, its deep visibility makes it a powerful ally in malware investigation. Security‑oriented users can:
-
Identify hidden or suspicious processes, including those without visible windows or with unusual parents.
-
Inspect loaded modules to spot DLL injections or unsigned binaries in trusted processes.
-
Monitor network connections for unexpected remote endpoints or persistent outbound traffic.
-
Examine handles and threads to understand how malicious code interacts with the system.
Because it is portable and does not require installation, System Informer Portable can be run from a USB stick in incident response scenarios where the integrity of the system is in question. Its MIT‑licensed source code also allows auditors and researchers to review and extend its behavior for specialized forensics tasks.
Debugging and Development Features
For developers, System Informer Portable offers several capabilities that assist in debugging complex Windows applications. Detailed stack traces—including kernel‑mode, WOW64, and managed (.NET) components—help pinpoint deadlocks, infinite loops, or unexpected call paths. Thread views show CPU consumption and states, letting programmers isolate hot threads or those stuck waiting on synchronization objects.
By inspecting modules and environment variables, developers can confirm which DLL versions are being loaded, how PATH and other variables are set at runtime, and whether configuration files are being picked up as expected. Combined with handle enumeration, this makes it easier to detect resource leaks, incorrect file access patterns, and configuration errors without instrumenting the code itself.
Portability, Licensing, and Compatibility
System Informer Portable is distributed as a small, portable executable, with no required installer or background services. Users can simply unpack it to a folder or USB drive and run it directly, making it ideal for troubleshooting multiple machines. It provides separate binaries for 32‑bit, 64‑bit, and ARM64 architectures, automatically selecting the appropriate one for best performance and compatibility.
The project is licensed under the MIT license, which allows free use, modification, and redistribution, including in commercial environments. Designed specifically for Windows, it focuses on deep integration with the Windows API and kernel, and is commonly used as an advanced replacement for standard monitoring tools.
Typical Use Cases and Scenarios
System Informer Portable proves useful in a wide range of real‑world situations:
-
Performance Troubleshooting: Identifying which process is causing CPU, RAM, disk, or GPU spikes, and taking corrective action by adjusting priorities or terminating tasks.
-
File Lock Issues: Determining which application is preventing a file from being edited or deleted, then safely closing the handle or process.
-
Network Diagnostics: Tracking down unexpected bandwidth usage, discovering hidden update services or malware beacons, and closing suspicious connections.
-
Service Tuning: Managing services on workstations or servers, disabling unnecessary background services, or inspecting suspicious entries.
-
Malware Analysis Light: Spotting unusual processes, injected DLLs, or stealthy network activity as part of a broader incident response toolkit.
-
Development and QA: Debugging hung applications, inspecting resource usage during load testing, and analyzing thread behavior without modifying code.
Through its combination of detailed system insight, powerful controls, and a portable, open‑source implementation, System Informer Portable provides an all‑in‑one environment for understanding and managing what is really happening on a Windows machine.


